Discover
The embedded point-and-click editor where you pick fields, filter, run a query, choose a chart, drill, and save — no SQL required.
When to use it: Any time you need to answer a data question — explore a metric, build a chart, or edit a Mosaic tile.
Where to find it: Left nav → Discover (route
/discover), then pick a reveal to open the builder at /discover/:domain/:reveal. The same editor also opens when you edit a tile inside a Mosaic.Who can use it: Tracer, Weaver, and Luminary (any role with the
run_discover permission).Discover is where analysis happens in Celiq. You choose a reveal (a curated starting point in your semantic model), pick the attributes and metrics you care about, optionally add filters and calculations, then click Run. Celiq compiles the SQL, runs it against your warehouse, and renders the result as a chart or table. Because every query is built from your Forge definitions, it automatically respects your Data Keys, Data Gates, and role permissions — you never have to remember to scope a query to your access level.
Discover is also the editor you use inside Mosaics. When you edit a Mosaic tile, the same Discover surface opens pre-loaded with that tile's query, so there is one editing experience to learn, not two.
Overview
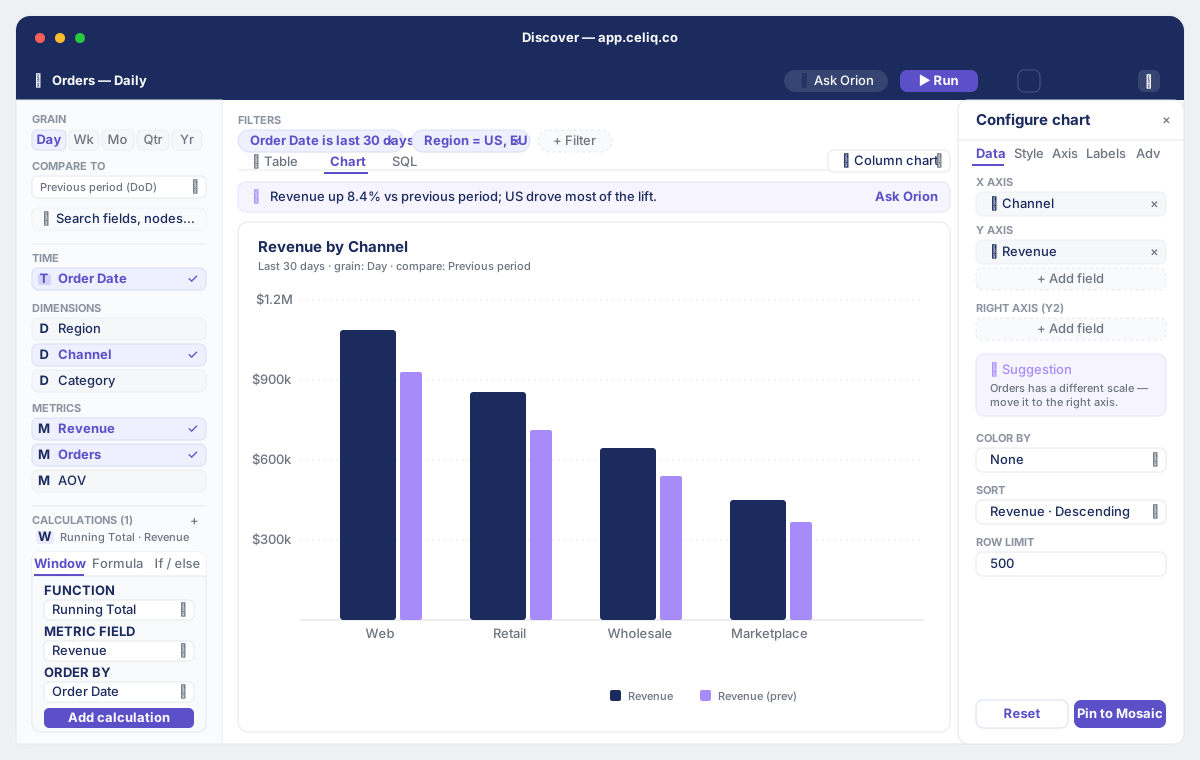
The Discover editor is split into three working areas:
- Left — the FieldPanel. Select a reveal, then browse and search its fields. Fields are grouped into TIME, DIMENSIONS, METRICS, ML, and CALCULATED sections. This is also where you set the grain and create calculated (derived) fields.
- Top — the action bar. Shows the reveal name, row limit, row count and query time, plus Ask Orion, Run, and a ⋯ menu for saving and exporting.
- Center/right — results and configuration. A tabbed area showing Results (chart or formatted table), SQL, History, Comments, and Notes. The ChartConfigurePanel opens on the right to style the chart, pick a chart type, or ask the Orion chart copilot.
Everything you build is captured as query state in the URL (a short query ID), so a refresh restores your work and the link is shareable.
When to use it
Reach for Discover when you want to:
- Answer an ad-hoc question against a reveal ("orders by week for the last quarter").
- Build a chart you intend to save as a Prism or pin to a Mosaic.
- Add a derived metric (AOV, margin) without changing your CML model.
- Drill from a summary chart into the detail behind a single point.
- Edit an existing Mosaic tile — the tile editor is Discover.
If you only need to read an existing dashboard, open a Mosaic instead. If you need to change the underlying data model (add a metric to the semantic layer permanently), use Forge.
Concepts
| Term | What it means |
|---|---|
| Reveal | A named starting point defined in a domain — a primary node plus any joins, with suggested attributes and metrics. You always build on top of a reveal. |
| Attribute (dimension) | A descriptive field you group or filter by (country, channel, product). Shown with a blue A badge. |
| Metric | A numeric measure that gets aggregated (revenue, order count). Shown with a green M badge. |
| Time field | A date or timestamp attribute. Shown with an amber D badge; its rollup is controlled by the grain. |
| Grain | How time is bucketed — Day, Week, Month, Quarter, or Year. Set with the grain pills in the panel. |
| Calculated field | A browser-side derived field you define with a simple expression like [revenue] / [orders]. |
| ML metric | A predict/anomaly/classify measure, shown with a purple ML badge. |
| Query ID (qid) | The short identifier Celiq stamps in the URL so your query state can be restored and shared. See Query IDs. |
Getting started
Prerequisites- You have the Tracer, Weaver, or Luminary role (the editor requires the
run_discoverpermission). - Your workspace has at least one reveal. Reveals are authored in a domain in Forge — if none exist, the FieldPanel shows a "No reveals yet" prompt linking you to Forge.
- The reveal's project has an active warehouse connection.
Go to Discover
Click Discover in the left navigation. This opens the reveal picker at /discover.
Choose a reveal
Pick a reveal to open the builder. The editor navigates to /discover/:domain/:reveal and loads that reveal's fields. You can switch reveals at any time from the REVEAL selector at the top of the FieldPanel.
Step-by-step
Select a reveal
In the FieldPanel, use the REVEAL dropdown to pick (and search) a reveal. Its TIME, DIMENSIONS, and METRICS sections populate from the reveal's primary node and joins.
Add fields
Click a field to add it to your query. Attributes become grouping columns; metrics become aggregated values. Use Search fields… to filter the list, or the All Fields / In Use toggle to see only what you have selected. On a selected metric you can change the aggregation (SUM, COUNT, COUNT DIST, AVG, MIN, MAX) from the inline picker.
Set the grain
Use the grain pills — Day, Week, Month, Quarter, Year — to choose how time is bucketed. If a field group fixes the grain, the pills are disabled and labelled "set by field group".
Add filters (optional)
Open the Filters bar and click Add filter. Choose a field, an operator (operators adapt to the field type — text, number, or date), and a value. Date filters support relative ranges like "is in the last 7 days", explicit ranges, and "is this week / today". You can also set Compare to here to add a previous-period comparison (the options match your grain — MoM, YoY, WoW, and so on).
Run the query
Click Run (the button is disabled until you have at least one field and no invalid filter). The row count and duration appear in the action bar; a Cached badge shows when results came from cache.
Choose how to visualise it
On the Results tab, Celiq auto-selects a sensible chart for your fields. To change it, open the ChartConfigurePanel and click the chart-type button to launch the Smart Chart Picker, or click Copilot to ask Orion to configure the chart for you. The panel's tabs (Data, Style, Axis, Labels, Conditional, Advanced) only show controls the chosen chart actually supports.
Inspect the SQL
Switch to the SQL tab to see the exact, read-only SQL Celiq generated. Use Copy to copy it, or Studio to open it in the SQL studio.
Save or share
Open the ⋯ menu to Save as Prism, Add to Mosaic (a live tile), Copy share link, Save query, Schedule delivery, or Export (CSV, Excel, PNG, PDF — the available formats depend on the chart type).
Examples
Worked example — weekly revenue by channel, last 90 days.- Select the Orders reveal.
- Add the time field Created At and the attribute Channel.
- Add the metric Revenue (leave the aggregation as SUM).
- Set the grain to Week.
- Add a filter: Created At → is in the last → 90 days.
- Click Run. Open the chart picker and choose a Line chart, with Channel on color.
To add average order value without touching your model, create a calculated field in the FieldPanel using existing field names in square-bracket syntax:
Label:      Avg order value
Expression: [revenue] / [orders]
Format:     Currency ($)
Calculated-field expressions are evaluated per row in the browser and only allow safe arithmetic (+ - * / ( )); non-numeric values resolve to 0. For cumulative, ranked, or period-over-period math computed in the warehouse, add a window calculation from the Calculations section instead (Running Total, Rolling Average, Rank, Lag/Lead, % of Total, and more).
The generated SQL for the example above looks similar to this (your dialect and column names will vary):
SELECT
  DATE_TRUNC('week', created_at) AS created_at_week,
  channel,
  SUM(revenue)                   AS revenue
FROM orders
WHERE created_at >= CURRENT_DATE - INTERVAL '90 days'
GROUP BY 1, 2
ORDER BY 1
LIMIT 1000;
Best practices
- Start from the right reveal. The reveal determines which nodes (and therefore which fields and joins) are available. Switching reveals is faster than fighting the wrong one.
- Keep the row limit sensible. The limit control offers 100 / 500 / 1,000 / 5,000 / 10,000. Use a small limit while iterating, raise it only for exports.
- Filter before you raise the limit. Filters reduce work in the warehouse; a higher limit does not.
- Define reusable math in CML. Browser calculated fields and table calculations live with this query only. If you'll reuse a derived metric across Prisms, Mosaics, or Signals, promote it to a metric in Forge (the ⚙ Save to Forge action on a window calculation generates the CML for you).
- Edit Mosaic tiles in place. Because the tile editor is Discover, you get the full FieldPanel, chart picker, and SQL view — there is no reduced "tile editor". Use Save to tile to write changes back.
Tips
Press Run after each change to see results update — Discover does not auto-run on every click, so you stay in control of when the warehouse is queried. The query state is saved to the URL as a query ID, so you can refresh or share the link and land back exactly where you were. When comparison is on, a small ⇄ badge appears in the action bar so you know extra comparison columns are in the result.
Common mistakes
Expecting calculated fields to aggregate. A calculated field computes per row on the loaded results — it cannot SUM across rows. Use a window calculation (e.g. Running Total) for that.
Looking for fields that aren't there. The FieldPanel only shows fields from the reveal's nodes, and fields hidden by a Data Gate are omitted entirely — if a field is missing, check the reveal definition and your access. A 🔒 icon marks fields you can see but are restricted from using.
Trying to edit the SQL. The SQL tab is read-only; it is compiled from your CML. Change the query by changing fields, filters, and grain.
Troubleshooting
| Symptom | Likely cause | Fix |
|---|---|---|
| FieldPanel shows "No reveals yet" | No reveal authored in any domain | Create a reveal in Forge (the prompt links there). |
| "No nodes found for this reveal" | The reveal's primary node/joins aren't defined | Check the domain definition in Forge so the primary node and joins resolve. |
| "Cannot reach data warehouse" | The warehouse connection is down or misconfigured | Check the connection in the Admin Console / Warehouses. |
| "Access denied — the warehouse service account lacks permission…" | The connection's credentials can't query that table/dataset | Grant the service account access to the table/dataset. |
| "Table or dataset not found" | The node's physical table or the connection's project/dataset is wrong | Verify the node's physical_table and the connection's project/dataset. |
| "BigQuery location mismatch" | The connection region differs from the dataset region | Set the connection's location to match the dataset. |
| "Query timed out" | Result set too large or query too heavy | Lower the row limit or add filters, then re-run. |
| Filter-value dropdown is empty | Restricted by policy, or the field's column couldn't be resolved | Confirm you have access to the node; check the field's column mapping in the node CML. |
Related pages
- Chart types — the full catalogue of charts the picker offers
- Query IDs — how Discover saves and restores query state in the URL
- Filters — operators, relative dates, and comparison periods in depth
- Prisms — save a Discover query as a standalone, shareable Prism
- Mosaics — pin a Discover query as a live tile on a dashboard
- Forge — define the reveals, nodes, and metrics Discover builds on