Semantic Health
A 0-100 health score plus issue-level analysis of your semantic layer, with severity-tagged issues and suggested fixes.
When to use it: Whenever you want to know why Orion's answers feel uneven, or before relying on the semantic model for important questions.
Where to find it: Context Studio → Quality → Semantic Health.
Who can use it: Weaver and Luminary can view it. Only Luminary can run Recompute.
Semantic Health turns the abstract question "is my semantic layer in good shape?" into a number you can track and a checklist you can act on. It scans your nodes, reveals, certifications, drill paths, and pending corrections, then reports a score out of 100 alongside the individual problems that pulled the score down.
Overview
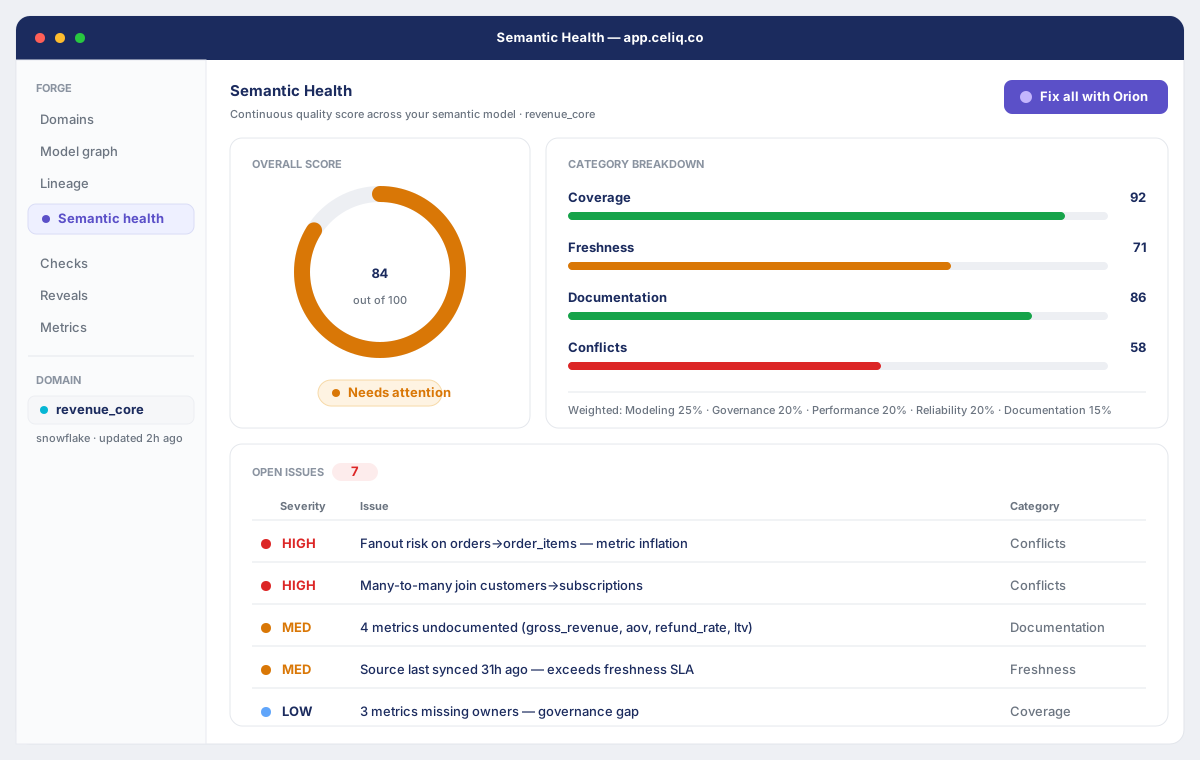
The Semantic Health tab has three parts, top to bottom:
- Score card — a large number (0-100) labelled Health score / 100. The colour reflects the band: green at 80 and above, amber from 60 to 79, red below 60.
- Summary stats — four cards next to the score: Nodes, Reveals, Certified (certified reveals), and Issues. The Issues card is flagged when the count is above zero.
- Issue list — one row per detected problem. Each row carries a severity badge (
error,warning, orinfo), a plain-language message, and, where available, a suggested fix shown beneath the message.
When nothing is wrong, the issue list is replaced by a green "No issues found — Your semantic layer is well-configured." state.
The score and issues are computed fresh from your current data every time the tab loads, so what you see always reflects the live state of the workspace.
When to use it
- After modelling work in Forge. Once you add or edit nodes, metrics, or reveals, check Semantic Health to confirm you did not leave descriptions blank or reveals uncertified.
- Before trusting Orion on a topic. A low score, or unresolved
error-level issues, is a signal that Orion may answer with lower confidence. - As a recurring hygiene check. Re-open the tab periodically to catch reveals that drifted out of certification or corrections that piled up unreviewed.
Concepts
| Term | Meaning |
|---|---|
| Health score | A single 0-100 number. It starts at 100 and is reduced by each issue found; it never drops below 0. |
| Issue | One detected problem in the semantic layer. Every issue has a severity, a message, and usually a fix. |
| Severity | How serious the issue is: error (red), warning (amber), or info (grey). |
| Reveal | A defined query (a chartable metric/visualization). The score considers how many reveals exist and how many are certified. |
| Certified reveal | A reveal that has been reviewed and certified. Uncertified reveals lower the score and reduce Orion's confidence. |
| Orphan reveal | A reveal not used by any dashboard tile — defined but unpinned. |
| Pending correction | An Orion correction that has not yet been applied or dismissed. |
Getting started
You need a workspace with at least one connected warehouse and some modelled nodes — Semantic Health has nothing to score on an empty model.
Open Context Studio
From the main navigation, go to Context Studio.
Go to the Quality group
In the left sidebar, find the Quality group and click Semantic Health.
Read the score and stats
The score card and the four summary stats (Nodes, Reveals, Certified, Issues) load automatically.
Step-by-step
Check the score band
Read the big number on the score card. Green (80+) is healthy; amber (60-79) means there is room to improve; red (below 60) means the model needs attention before you rely on it.
Scan the summary stats
Compare Reveals against Certified. A large gap means many reveals are uncertified, which is one of the biggest score penalties. A non-zero Issues count tells you how many rows to work through below.
Work the issue list by severity
Start with error rows (red), then warning (amber), then info (grey). Each row's message tells you exactly what is wrong — for example, a named node with no description, or the number of uncertified reveals.
Apply the suggested fix
Read the fix line under each issue and follow it. Fixes point you to the right place — Forge to add a description or certify reveals, Context Studio → Drill Paths to add exploration guidance, or Quality → Corrections to clear pending corrections.
Recompute (Luminary only)
After making fixes, a Luminary can click Recompute in the section header. This re-runs the analysis and refreshes the score, stats, and issue list. While it runs, the button reads "Computing…".
Examples
A workspace with twelve reveals, only four of them certified, two nodes missing descriptions, and one pending correction would surface a list like this:
Health score: 71 / 100   (amber)

Nodes 9   Reveals 12   Certified 4   Issues 5

[error]    8 reveals (67%) are not certified
           → Certify reveals in Forge to improve Orion confidence
[warning]  Node "orders" has no description
           → Open Forge → orders and add a description
[warning]  Node "returns" has no description
           → Open Forge → returns and add a description
[warning]  1 correction pending review
           → Review and apply corrections in Quality → Corrections
[info]     3 reveals are not used by any dashboard
           → Pin them to a Mosaic or archive unused metrics
After certifying the eight reveals and writing the two descriptions, a Luminary clicks Recompute and the score climbs back into the green band, with the cleared issues dropping off the list.
The kinds of issues Celiq detects, and how each affects the score:
| Issue | Severity | Score impact |
|---|---|---|
| Node has no description | warning | -2 per node |
| Node has no metrics | info | -1 per node |
| Reveals not certified | warning, or error when more than 5 | down to -20 |
| Reveals not used by any dashboard (orphans) | info | down to -10 |
| No drill paths defined (with at least one node) | info | -3 |
| Corrections pending review | warning | down to -15 |
Best practices
- Certify reveals as you finalize them. Uncertified reveals are the heaviest, most common drag on the score and directly lower Orion's confidence.
- Always give nodes a description. It is cheap to fix and improves both the score and the quality of AI answers.
- Keep the pending-corrections queue near zero. Review corrections in Quality → Corrections so they stop counting against you.
- Recompute after a batch of fixes, not after every edit. Make several changes, then have a Luminary recompute once to see the combined effect.
Tips
The Context Studio Overview tab shows the same Semantic Health score at the top, with a one-line read ("Well configured — Orion is ready." or a prompt to improve). Use Overview for the quick glance, and the Semantic Health tab when you want the full issue list.
Common mistakes
Semantic Health (this tab) — a 0-100 score with an itemized list of issues and fixes for the semantic layer.
Context Health — the small composite gauge pinned at the bottom of the Context Studio sidebar. It shows the same overall score broken into three weighted bars: Certified reveals, Eval pass rate, and Corrections. It is a summary readout, not an issue list.
Data health — a separate Luminary-only audit page in Lumen that checks for structural problems like duplicate node names and misconfigured domains. It is not part of Context Studio and does not produce a 0-100 score.
A Weaver cannot recompute — the Recompute button only appears for Luminary roles. If you do not see it, the score still loads automatically; ask a Luminary to recompute after your fixes.
Troubleshooting
| Symptom | Cause | Fix |
|---|---|---|
| Page shows "Loading semantic health…" and never resolves | The request to fetch the health data failed | Reload the page; if it persists, confirm the workspace has a connected warehouse and modelled nodes |
| Score looks stale after you fixed issues | The score reflects the state at load time | Reload the tab, or have a Luminary click Recompute |
| No Recompute button in the header | You are not a Luminary | Recompute is Luminary-only; ask a workspace admin to run it |
| "No issues found" but the score is below 100 | Not all penalties surface as separate rows for every object | Open the Overview and Context Health summary; certifying reveals and adding node descriptions are the highest-impact improvements |
Many error/warning rows about uncertified reveals | A large share of your reveals are not certified | Certify them in Forge; uncertified reveals carry the largest penalty |