Workbooks
A freeform, multi-page canvas for ad-hoc analysis — mix tables, charts, KPIs, pivots, text, and filter controls.
When to use it — Exploratory or ad-hoc reporting that needs more than a single Discover query but does not need the governance of a Mosaic dashboard.
Where to find it — Open Workbooks in the left navigation, then open a workbook or create one. The URL is
/workbooks; an individual workbook lives at /workbooks/:id. (The legacy /canvas URL redirects to /workbooks.)Who can use it — Lens can view published workbooks. Tracer can additionally run elements (query data). Weaver and Luminary can create, edit, and publish.
A workbook sits between Discover — a single query — and a Mosaic — a governed, pinned dashboard. It gives you a blank, multi-page canvas where you assemble several connected elements at once and wire interactive filter controls to them, all without leaving the page.
Overview
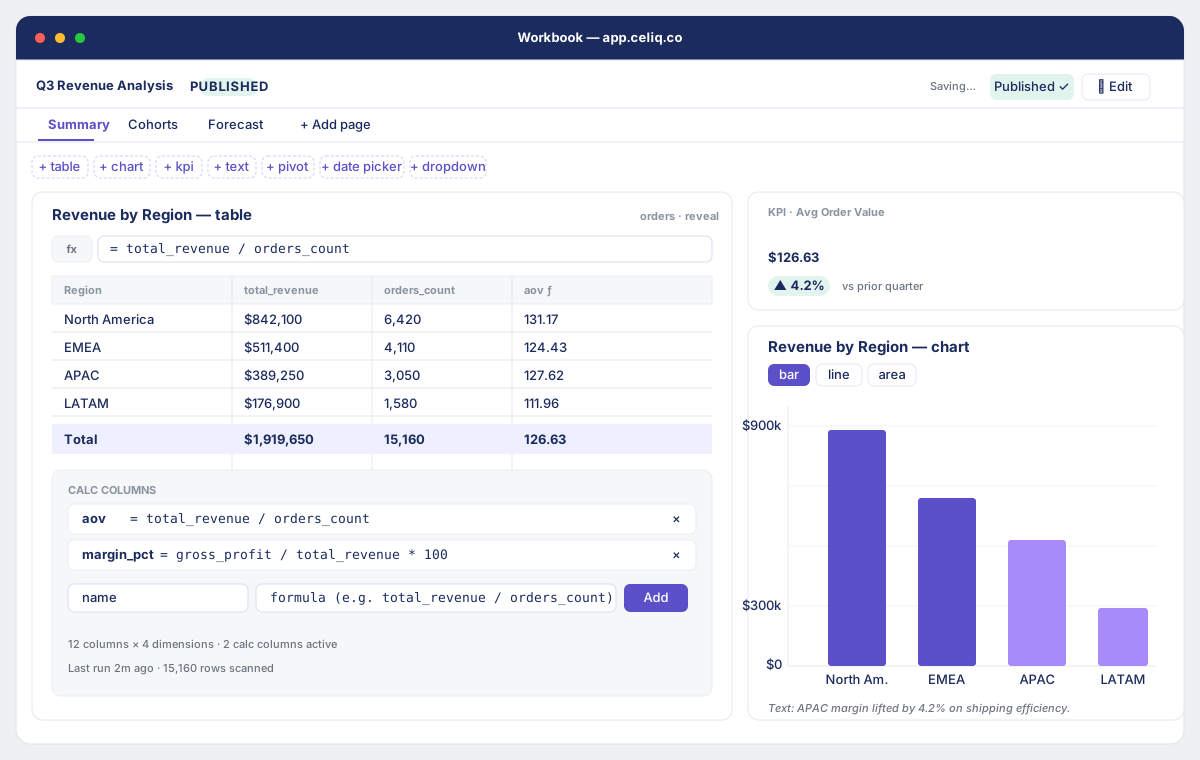
Each workbook has a title, a status (draft or published), and one or more pages. A page holds elements laid out on a 12-column grid. There are seven element types, in two families:
- Data elements — Table, Chart, KPI, and Pivot. Each connects to a domain + reveal and runs a query to show live data.
- Layout and control elements — Text (a free-text block), Date range, and Dropdown. The two controls feed page-level filters into the data elements on the same page.
You build in Edit mode and read in view mode. Edits to titles, pages, and elements are saved to the server as you make them — there is no separate save button for canvas content. When you are ready to share, you Publish the workbook to your workspace.
When to use it
Reach for a workbook when:
- You are exploring a question and want several views — a table, a trend chart, a headline KPI — on screen together.
- You want viewers to slice the whole page interactively with a Date range or Dropdown control.
- You need saved calculated columns on a table (for example, a derived AOV or margin) that persist with the analysis.
- The analysis is useful to colleagues but does not need to become a governed dashboard.
Prefer a Mosaic when you need a fixed, governed dashboard built from reveals, or Discover when a single ad-hoc query answers the question.
Concepts
| Term | What it means |
|---|---|
| Workbook | The top-level document. Has a title, a draft / published status, and one or more pages. |
| Page | A tab within a workbook. Each page has its own elements and its own filter state — controls on one page do not affect another. |
| Element | A single item on the canvas grid: a data element (table, chart, KPI, pivot) or a layout/control element (text, date range, dropdown). |
| Data source | The domain + reveal a data element queries. Picked from the same explores Discover uses. You can leave fields unselected to use the reveal's defaults. |
| Page filters | The combined set of filters produced by the Date range and Dropdown controls on the current page, applied to every data element when it runs. |
| Calculated column | A named formula (for example aov = total_revenue / orders_count) added to a Table, evaluated when the table runs. |
| Status | draft (visible to editors only) or published (visible to the whole workspace, with your name as author). |
Getting started
Workbooks live in your workspace. You need a connected warehouse and at least one domain with a reveal so data elements have something to query.
Open Workbooks
Click Workbooks in the left navigation to open the list at /workbooks.
Create or open a workbook
Open an existing workbook, or create a new one. (Creating requires the Weaver or Luminary role.) A new workbook starts as a draft with one page named Page 1.
Enter Edit mode
Click Edit in the top-right of the workbook header. The element toolbar and page controls only appear in Edit mode. Click Done to return to view mode.
Step-by-step
Name the workbook
In Edit mode the title becomes an input. Type a name — it saves automatically about half a second after you stop typing, and a small Saving… note appears in the header while it persists.
Add an element
With Edit mode on, click one of the toolbar buttons above the canvas: + table, + chart, + kpi, + text, + pivot, + date picker, or + dropdown. The new element appears on the grid.
Connect a data source
For a table, chart, KPI, or pivot, the element first shows Connect a data source. Pick a Domain, then a Reveal, and click Connect data source. The element then runs its query automatically.
Choose fields
With the source connected, the field picker appears in Edit mode. Tick Dimensions (group by) and Metrics to shape the query. Leave everything unchecked to use the reveal's default fields. For a chart, also pick bar, line, or area. For a table, add calculated columns. For a pivot, set Rows, Columns, Values, and the Aggregation.
Resize or remove an element
Click the ⋯ menu on an element header. Choose a Width — Small (4 columns), Medium (6), or Large (12) — or Delete to remove it.
Add filter controls
Add a Date range or Dropdown control. Set the field it filters on (and, for a dropdown, the list of options, one per line). In view mode, the value a viewer picks is applied as a filter to every data element on that page.
Add more pages
In Edit mode, click + Add page in the page tab bar to add a page. Click a tab to switch pages. Each page keeps its own elements and its own filter state.
Publish
Click Publish in the header to set the workbook's status to published and stamp a publish time. It now appears in everyone's Workbooks list with your name as author. The button shows Published ✓; click it again to unpublish back to draft.
Examples
A simple revenue overview page: a KPI for total revenue, a line chart of revenue by day, and a table broken out by channel with a calculated average order value.
For the table, connect it to your sales domain and orders reveal, tick the channel dimension and the total_revenue and orders_count metrics, then add a calculated column:
name:    aov
formula: total_revenue / orders_count
The formula is evaluated when the table runs and the new aov column is appended to the result. A calculated column references columns already in the table's result set.
To let viewers scope the whole page to a period, add a Date range control and set its field to your date column (for example created_at). When a viewer picks a start and end date, every data element on the page re-runs with that range applied:
{ "field": "created_at", "operator": "between", "value": ["2026-01-01", "2026-03-31"] }Best practices
- Use pages to separate themes. Because each page has independent filters, give distinct analyses their own page (for example "Overview", "By channel", "Cohorts") rather than crowding one page.
- Lean on default fields first. Leave metrics and dimensions unchecked to start — the element uses the reveal's defaults — then narrow the selection once you see the shape of the data.
- Pair controls with the data on the same page. A Date range or Dropdown only filters elements on its own page, so keep the control and the elements it should affect together.
- Keep the table the source of derived numbers. Calculated columns are available on Table elements; build derived measures there.
- Publish when it's ready to share. A
draftis visible to editors; publish to put it in front of the whole workspace.
Tips
The title saves on its own, on a short debounce — you do not need a save button, and you can keep editing while the Saving… note clears. Page, element, and config changes are likewise written to the server as you make them.
Common mistakes
- Expecting a control to filter another page. Filters are per-page. A Date range on the Overview page does not touch elements on the Cohorts page.
- Filtering on the wrong field. A Date range or Dropdown sends a filter on the exact field name you set. If that field is not part of an element's reveal, that element won't be filtered as expected — set the control's field to a column the elements actually expose.
- Choosing pie or map for a chart. Workbook charts render as bar, line, or area only. For other visualizations, use Discover or a Mosaic.
- Trying to delete the last page. A workbook must keep at least one page; deleting the only remaining page is rejected.
Troubleshooting
| Symptom | Cause | Fix |
|---|---|---|
| Element shows Connect a data source | The table/chart/KPI/pivot has no domain + reveal yet | Pick a Domain and Reveal and click Connect data source. |
| No data returned | The query ran but matched no rows — often the selected fields or active page filters exclude everything | Widen or clear the Date range / Dropdown control, or adjust the selected metrics and dimensions. |
| An error message with a Retry button | The element's query failed to run | Click Retry. If it persists, change the data source or check the reveal in Discover. |
| A raw-SQL element returns nothing for some viewers | Raw-SQL canvas elements bypass the policy engine, so they are blocked for non-Luminary viewers and fail closed | Use a reveal-backed element, or view as a Luminary. |
| Cannot delete the last page | A workbook must always have at least one page | Add another page first, then delete the one you no longer want. |
| A data element doesn't react to a control | The control's field isn't in that element's reveal, or the control is on a different page | Set the control's field to a column the element exposes, and keep the control on the same page. |
| Pivot: Run a query to see the pivot table | The pivot has a source but hasn't returned rows yet | Connect a source and select fields so the query returns data, then set the pivot Rows / Columns / Values. |