Mosaics
Build living dashboards from a draggable grid of tiles — pin Prisms, set a global date and comparison, filter, drill, and publish to your team.
When to use it: When you want one shared page that answers a recurring business question and stays current without anyone re-running queries by hand.
Where to find it: Left nav → Mosaics (list at
/mosaics; a single mosaic opens at /mosaics/:id).Who can use it: Everyone can open and read a mosaic. Weaver and Luminary can create, edit, and publish.
A Mosaic is a dashboard you build once and return to every day. Each tile traces back to a Reveal in the semantic layer, so every tile respects your Data Keys, Data Gates, and role-based permissions automatically. A mosaic-wide toolbar lets you change the date, time grain, and comparison across the whole page at once, and a filter bar applies dimension filters to every tile that supports them.
Tiles are live: they do not snapshot data. Each tile re-runs its own query when you open the mosaic, hit Rerun all tiles, or change the global date, grain, comparison, or filters.
Overview
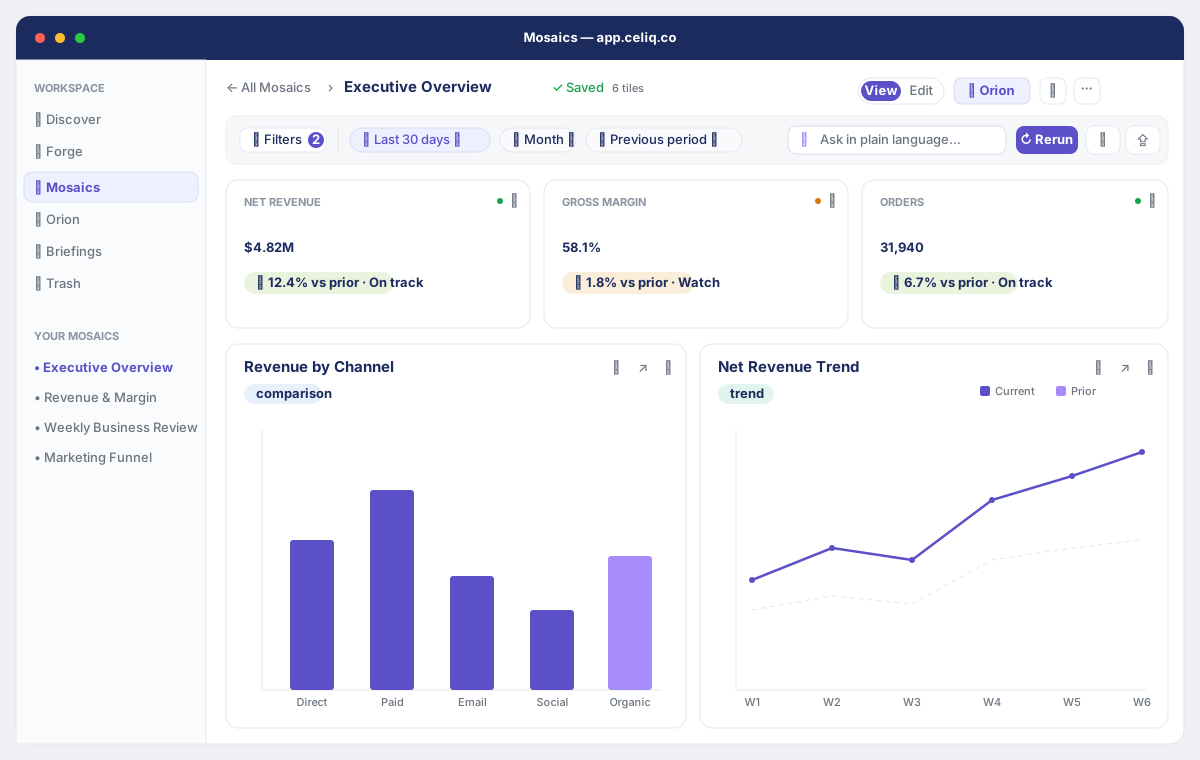
The mosaic detail page (/mosaics/:id) is organised top to bottom:
- Title row — the breadcrumb (
Mosaics / <name>), inline tabs, a "Refreshed" timestamp, and the action buttons: Share, Ask Orion, Intel, Edit, and the ⋯ menu. - Orion briefing banner — a dark band above the grid that summarises what the dashboard is telling you (headline metrics plus Key driver / Risk / Recommended action), with a chat handle into Orion.
- Filters toolbar — the indigo "Filters" bar holding the global date chip, frame (time grain), comparison, dimension filters, an Ask-Orion natural-language input, and saved bookmarks.
- KPI row — auto-derived summary cards for your most-used metrics, with sparklines and a delta when comparison is on.
- The tile grid — a 24-column draggable, resizable layout of tiles.
The list page (/mosaics) shows every mosaic you can see, each with a tile count, a status badge (Draft / Team / Public), and the last-updated date.
When to use it
Reach for a Mosaic when you want to:
- Track a fixed set of metrics that you (or your team) check on a schedule — revenue, orders, returns, funnel health.
- Give non-analysts a self-serve page they can filter and drill without writing SQL.
- Publish a single source of truth to your team instead of emailing screenshots.
- Compare periods at a glance — week over week, month over month, year over year, or against the previous period.
If you only need to explore an ad-hoc question once, use Discover instead and pin the result later.
Concepts
| Term | What it means |
|---|---|
| Tile | One cell in the grid. Can be a chart, a KPI, a table, a text/section/media block, a goal, a decision log, or a forecast. |
| Prism | A saved, governed Reveal. Pinning a Prism is the fastest way to add a chart tile. See Prisms. |
| Frame (grain) | The time bucket the whole mosaic rolls up to: Day, Week, Month, Quarter, or Year. |
| Comparison | A period-over-period overlay: Previous period, WoW, MoM, QoQ, YoY, or a custom range. Only available once a frame is set. |
| Global date | A single date window applied to every tile that has a date dimension. |
| Cross-filter | Clicking a value in one tile and filtering the rest of the mosaic by it. See Cross filtering. |
| Tab | A named sub-page within one mosaic. Tiles belong to a tab; an untagged set shows under a virtual "Summary" tab. |
| Visibility | Who can see the mosaic: Private (Draft), Team, or Public. |
Getting started
Prerequisites: at least one connected warehouse and a domain with Reveals, so there is something to pin. To create or edit a mosaic you need the Weaver or Luminary role; Tracer and Lens can open and read.To open Mosaics, click Mosaics in the left navigation. The list page (/mosaics) opens. Click any row to open that mosaic, or use the buttons in the header to start a new one.
Step-by-step
Create a mosaic
On the Mosaics list, click + New Mosaic, give it a name and an optional description, and confirm. New mosaics are created as Private (Draft) — only you see them until you publish. You can also click ✦ Build with Orion and describe the dashboard you want ("Show me revenue trends, customer growth, and top products"); Orion picks the best governed Reveals and assembles the tiles for you.
Enter edit mode
Open the mosaic and click ✏️ Edit in the title row. The button changes to ✓ Editing and a yellow edit bar appears with + Add tile, Undo, Save layout, and Discard.
Add a tile
Click + Add tile. In the Add tile dialog, choose a tile type (bar, line, area, KPI, table, text, divider, media, goal, decision log, or forecast), give it a title, and — for data tiles — pick a Reveal. Click Add tile to drop it on the grid. The fastest path for an existing chart is to pin a Prism: in Discover, run a Reveal and choose Add to Mosaic to open the 📌 Add to Mosaic dialog, name the tile, and pick the target mosaic.
Arrange the grid
With edit mode on, drag a tile by its handle to reposition it, and drag the bottom-right corner to resize. The grid is 24 columns wide; tiles snap to whole columns. Use the Undo button (or ⌘Z) to step back through layout changes.
Set the global date, frame, and comparison
In the Filters toolbar, set a date window, pick a frame (Day/Week/Month/Quarter/Year), and turn on a comparison. Every tile with a date dimension re-runs to match. Comparison only becomes available once a frame is selected.
Save the layout
Click Save layout. Celiq persists tile positions and sizes and returns you to view mode. Clicking Discard instead reverts every position and size to exactly how they were when you entered edit mode — no partial saves.
Publish to your team
Open the ⋯ menu (or, on the list page, a mosaic's card menu) and set Visibility to Team so colleagues can find it, or Public for everyone in the workspace. Leave it Private to keep it as a personal Draft.
Examples
A weekly revenue dashboard, built in a few minutes:
- + New Mosaic → name it "Weekly Revenue".
- ✏️ Edit → + Add tile → a KPI for
total_revenue, a bar of revenue by country, and a table of top customers — each from your orders Reveal. - In the Filters toolbar set the date to Last 90 days, frame to Week, and comparison to WoW. The KPI row now shows a green/red delta and a sparkline; the bar chart rolls up weekly.
- Save layout, then ⋯ → Visibility → Team to publish.
Mosaics can also be defined and version-controlled as CML. Export the current mosaic from ⋯ → Get CML, and validate or re-import with Validate CML / Update from CML:
mosaic: weekly_revenue
title: Weekly Revenue
domain: ecommerce_bigquery
description: Core revenue KPIs, refreshed weekly

layout:
  columns: 24
  row_height: 80

tiles:
  - id: total_revenue
    title: Total Revenue
    type: kpi
    reveal: ecommerce_bigquery.orders_analysis   # domain.reveal_name
    metric: total_revenue
    size: { cols: 6, rows: 2 }

  - id: revenue_by_country
    title: Revenue by Country
    type: bar
    reveal: ecommerce_bigquery.orders_analysis
    metric: total_revenue
    dimension: country
    size: { cols: 12, rows: 4 }
Every tile's reveal reference is namespaced by its domain (ecommerce_bigquery.orders_analysis), never the bare Reveal name.
Best practices
- Pin Prisms for charts you already trust. A pinned Prism carries its governed definition, so the tile stays consistent with Discover.
- Set a frame before turning on comparison. Comparison is disabled until a grain is chosen, because there is no time axis to shift.
- Use the global date instead of per-tile dates when the whole page should move together — it is one click for the whole mosaic.
- Group related tiles into tabs rather than building one giant scroll. Tiles belong to the active tab; an untagged set appears under the "Summary" tab.
- Keep Drafts private until they are right. Create privately, then publish to Team once the layout and filters are settled.
- Rerun all tiles after big data loads (⋯ → Rerun all tiles) to refresh every tile and regenerate the Orion briefing.
Tips
Press R to rerun all tiles, and ⌘Z to undo a layout change while editing. Click 🔖 in the Filters toolbar to save the current filter set as a named bookmark, and 🔗 Share to copy a link to the exact filtered view you are looking at.
Common mistakes
Global date "doesn't apply" to a tile. A tile only responds to the global date if it has a date dimension Celiq can detect. Tiles with a pinned date override ignore the global date by design.
Edits disappeared. Layout changes are only persisted when you click Save layout. Closing the page or clicking Discard reverts to the last saved layout.
Teammates can't find your mosaic. A new mosaic is Private (Draft). Set visibility to Team or Public to share it.
Troubleshooting
| Symptom | Cause | Fix |
|---|---|---|
| Tile shows "This tile references fields that no longer exist in the node schema" | The Reveal's node changed and a selected field was removed or renamed | Open the tile's embedded Discover editor and re-pick the fields. |
| Tile shows Table not found | The source table is missing from the warehouse | Check the node's table in Forge and your warehouse connection. |
| Tile shows a permission error | Celiq cannot read the table for this viewer | Confirm warehouse access and that the viewer's Data Keys/Gates allow the rows. |
| Comparison silently turns off on a tile | The comparison query failed (e.g. no resolvable date range) and Celiq fell back to the simple query so the tile still renders | Set an explicit global date range, then re-run; the tile shows a "comparison skipped" hint when this happens. |
| Forecast tile says "Not enough historical data" | Fewer than 14 days of history for the chosen metric/date field | Widen the date field's history or pick a metric with more data. |
| Forecast tile says "ML service unavailable" | The ML service is down | Retry later; other tile types are unaffected. |
| PDF export downloads a non-PDF or fails | Server-side rendering hit an error | Celiq automatically falls back to the browser's print dialog — use it to save as PDF. |
Related pages
- Prisms — save and govern the Reveals you pin as tiles.
- Discover — build a Reveal, then pin it or open a tile's embedded editor.
- Filters — how the filter bar and per-tile filters resolve.
- Drill down — click a data point to drill into the semantic layer.
- Cross filtering — let a click in one tile filter the rest of the mosaic.