Use Orion Chart Copilot
Open the chart copilot in Discover or a tile's configure panel and ask Orion in plain language to configure or change a chart for you
Time: ~5 minutes
You'll need: A chart open in Discover or on a Mosaic tile
Role: Tracer, Weaver, or Luminary (anyone with access to Orion)
The chart copilot edits an existing chart by describing the change — distinct from Orion suggesting a chart for a fresh result. In this tutorial you'll open the copilot from the chart configure panel and ask Orion, in plain language, to set the chart type, axes, series, or formatting for you.
Before you start
- Have a chart open in Discover, or open a Mosaic tile's embedded Discover editor and its ChartConfigurePanel.
- Confirm you have Orion access (Tracer, Weaver, or Luminary).
- Read Orion chart copilot for what the copilot can change.
Steps
Open the configure panel
In Discover, hover the chart and click the ⚙ gear to open the ChartConfigurePanel. On a Mosaic tile, open the tile's embedded Discover editor to reach the same panel.
Open Copilot
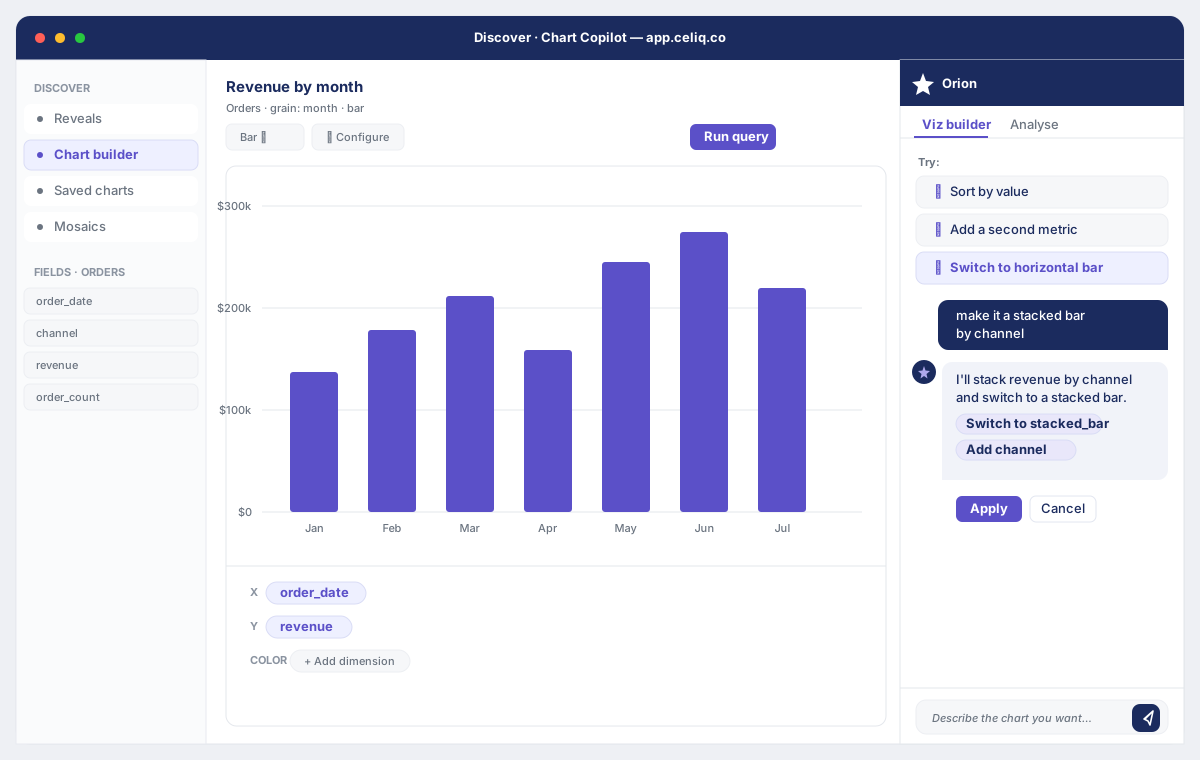
In the configure panel, click Copilot to start a natural-language conversation about this chart.
Describe the change you want
Type what you want in plain language — for example, "make this a horizontal bar chart sorted by revenue" or "add a year-over-year comparison line and format the axis as currency." Orion reads the current chart configuration and proposes the matching settings.
Review what Orion proposes
Orion applies its proposed configuration to the chart so you can see the result before committing. If it isn't quite right, refine your request in another message rather than starting over.
Save the configuration
When the chart looks right, Save the configuration in the configure panel. In Discover this persists to the Reveal; from a Prism's detail view, chart configuration set with the ⚙ gear is saved back to the Prism (unlike the session-only grain and comparison pills).
Result
The chart now reflects the change you described, and your saved configuration persists with the Reveal or Prism. Because the copilot edits the chart you already have, the underlying query and its governance are untouched — you've only changed how the result is drawn.
Next steps
- Create a Prism — save the configured chart so you can run and reuse it.
- Share a Dashboard — publish a Mosaic of copilot-tuned tiles.
- Orion's chart suggestions — how Orion picks a chart for a fresh result.