Orion's chart suggestions
How Orion picks and renders the best chart for a result set in chat, then offers to save it as a reveal or add it to a mosaic.
When to use it — Any time you ask Orion a data question. The chart appears on its own; you do not request it.
Where to find it — Open Orion from the left navigation. Suggestions appear under each answer that returned data.
Who can use it — Tracer, Weaver, and Luminary (anyone with access to Orion).
Orion does not just answer in words. After it pulls data, it decides which chart type best fits the shape of the result and shows you a visual version of the answer in the same chat bubble. It also tells you how confident it is in that choice, and gives you one-click ways to keep the result — save it as a reveal or pin it to a mosaic.
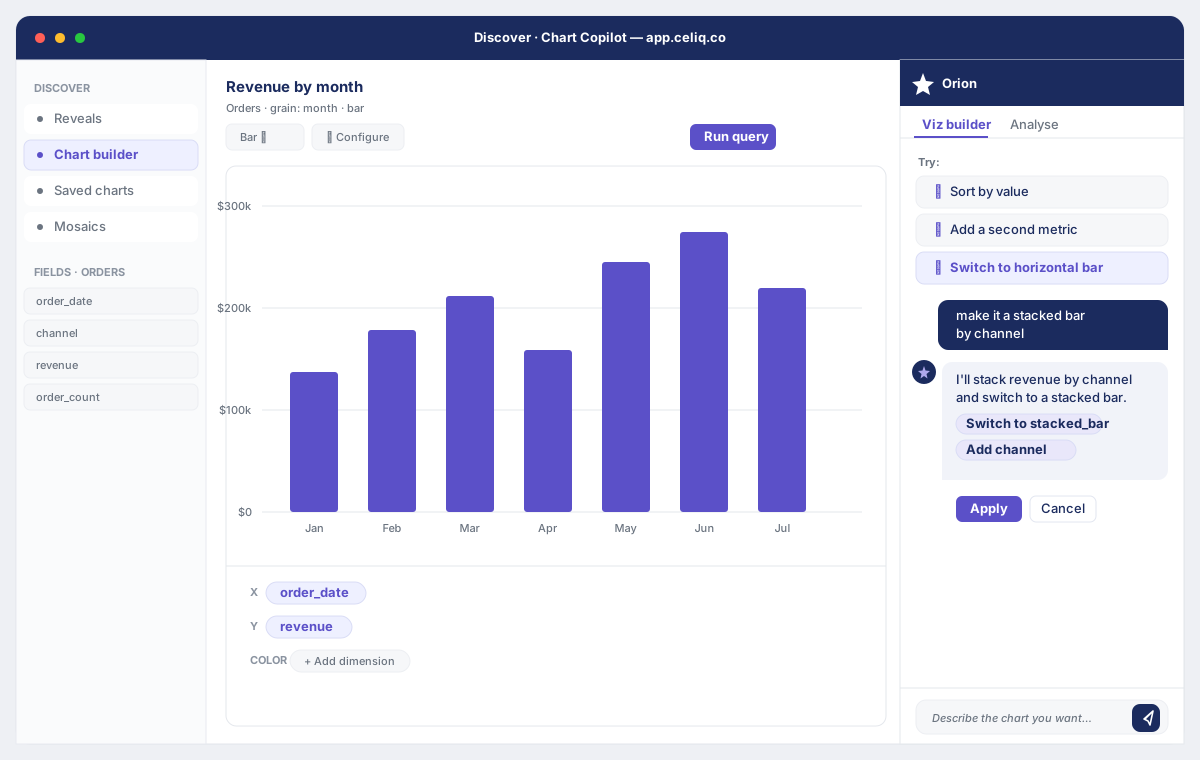
This page is about the chart Orion suggests on its own for a fresh result. If you want to change a chart that already exists on a tile or in Discover, that is a different tool — see Orion chart copilot.
Overview
Every time Orion runs a run_reveal or run_sql query and gets rows back, it does two things automatically before it replies:
- Picks a chart — it inspects the columns (metrics, dimensions, dates, geography) and the number of rows, then chooses a chart type such as a KPI, line, bar, map, or pie.
- Scores its confidence — it attaches a confidence value (roughly 0 to 1) for that choice, so you know how strong the recommendation is.
Inside the chat, Orion renders the answer as a structured analysis block when it produces one: an overall banner (the headline number and its change), dimension bars (a tabbed breakdown showing each segment's contribution), and a short list of insights. That structured block is the in-chat "chart". Alongside it, any answer that ran a query carries a save bar so you can turn the result into something permanent.
When to use it
- You asked Orion a question and want to see the answer, not just read it.
- You want a quick read on whether a result is best shown as a single number, a trend line, a ranked bar list, or a map — without setting up a chart yourself.
- You like an Orion answer and want to keep it: save it as a reveal in your semantic model, or pin it to a mosaic.
- You want a fast confidence signal on whether the chosen chart actually fits the data.
Concepts
| Term | What it means |
|---|---|
| Suggested chart | The chart type Orion picks for a result set, returned as suggestedChart. Values include kpi, line, multi_line, bar, horizontal_bar, grouped_bar, pie, scatter, map, and table. |
| Chart confidence | A score for how well the chosen chart fits the data, returned as chartConfidence. For example a single-row KPI scores 1.0, a map 0.90, a line 0.85, a bar 0.75, a fallback table 0.50. |
| Structured analysis block | The in-chat visual Orion renders when its answer is structured JSON: an overall banner, tabbed dimension bars, and bullet insights. |
| Overall banner | The headline row at the top of a structured answer — label, previous → current value, and a colored up/down change badge. |
| Dimension bars | A tabbed breakdown under the banner. Each tab is a dimension; each row is a segment with a bar sized by its contribution percentage and its value. |
| Save bar | The row of actions under a query answer: Save as reveal and Add to mosaic (and, for raw sql answers, a standalone Add to mosaic button). |
| Action card | A card Orion can return that links straight to a created mosaic — the gradient "Open in Mosaics" card. |
A "reveal" is a saved, governed query in your semantic model. A "mosaic" is a dashboard made of tiles. Saving an Orion result as a reveal makes it reusable in Forge; adding it to a mosaic pins the result as a tile.
Getting started
Prerequisites- Access to Orion (Tracer, Weaver, or Luminary).
- A connected warehouse and at least one modeled domain so Orion has data to query.
- For raw-SQL answers, note that
run_sqlis governed by role — non-admin roles may be refused for certain raw queries, and Orion will say so honestly rather than return a blank answer.
Open Orion
Click Orion in the left navigation to open the full chat page.
Ask a data question
Type a question that needs data, for example "Show me revenue by region last 30 days", and send it.
Read the answer and its visual
When the result returns rows, Orion renders the structured analysis block and shows the save bar beneath it.
Step-by-step
Ask Orion something that returns data
Send a question that maps to a metric over time, a breakdown by dimension, or a single number. Orion runs run_reveal (against your semantic model) or run_sql and gets rows back.
Orion picks the chart automatically
Behind the scenes, Orion examines the result columns and row count and chooses a chart type, then scores its confidence in that choice. You do not have to ask for this.
See the in-chat visual
If the answer is a structured analysis, you get the overall banner, the dimension bars, and the insights list rendered inline. If there is more than one dimension, click a tab to switch the breakdown.
Explain the change (optional)
On a structured analysis answer, an Explain the change button appears. Click it and Orion breaks the headline metric down by its top contributing dimensions, with delta values and contribution percentages.
Keep the result
Under a query answer you get the save bar. Name the insight in the field, then click Save as reveal to write it into the domain CML, or Add to mosaic to pick a mosaic (or create a new one) and pin it as a tile.
Open the created mosaic
After you add to a mosaic, a confirmation appears with an Open mosaic → link. If Orion itself created a mosaic for you, it returns an action card — the gradient Open in Mosaics card — that takes you straight there.
Examples
Ask Orion:
Show me revenue by region last 30 daysBecause the result has one metric, one dimension, and more than eight rows, Orion suggests a horizontal_bar chart. With one metric and a dimension but eight rows or fewer, it would pick a regular bar instead. The answer in chat renders as a structured analysis — an overall banner for total revenue and a "By Region" bar breakdown.
Ask a trend question:
What's the daily revenue trend over the last 90 days?Here the result has a metric and a date column with no breakdown dimension, so Orion suggests a line chart. Trend wording like "over time" or "last N days" also nudges Orion toward a line.
A single-number question:
What was total revenue yesterday?One metric, one row, no dimension or date — Orion suggests a kpi and scores it 1.0.
When Orion writes a raw query, it returns it in a fenced sql block, and an Add to mosaic button appears under that block:
SELECT region, SUM(net_revenue) AS revenue
FROM orders
WHERE order_date >= CURRENT_DATE - INTERVAL '30 days'
GROUP BY region
ORDER BY revenue DESC;
Best practices
- Phrase the question to match the shape you want. Words like "trend", "over time", or "last 30 days" steer Orion toward a line; "share", "breakdown", "split", or "distribution" with a small result steer it toward a pie.
- Use Save as reveal for things you will ask again. A reveal lives in your semantic model and is governed, so it stays reusable and consistent.
- Use Add to mosaic for monitoring. Pin the result as a tile so it refreshes on the dashboard instead of re-asking Orion each time.
- Name the insight before saving. The save bar's name field becomes the reveal name and the tile title — a clear name saves cleanup later.
- Treat low confidence as a prompt to refine. If Orion falls back to a
table(confidence0.50), the shape was ambiguous; tighten the question or pick the chart yourself after saving.
Tips
A pie only appears when your wording signals a share or distribution and the result has a single metric, a single dimension, and eight rows or fewer. If you want a pie and don't get one, add a word like "breakdown" or "share" and narrow the result. For a trend, mention the time frame so Orion reaches for a line.
Common mistakes
- Expecting a chart on a no-rows answer. Orion only suggests a chart after a query returns rows. If your question returns nothing, there is no suggestion to render.
- Confusing this with the chart copilot. This feature suggests a chart for a new result. Editing an existing chart is Orion chart copilot.
- Assuming a raw-SQL answer always saves the same way. Reveal-backed answers show the full save bar (Save as reveal + Add to mosaic); raw
sqlanswers show a standalone Add to mosaic button instead. - Ignoring a refusal. If raw SQL is restricted for your role, Orion surfaces that honestly. That is the governance guard working, not a bug — ask using a governed reveal or request access from a Luminary.
Troubleshooting
| Symptom | Cause | Fix |
|---|---|---|
| No chart or save bar under the answer | The query returned no rows, so there is nothing to chart | Broaden the date range or filters so the query returns data |
| Result shown as a plain table | Orion fell back to table because the column shape was ambiguous (confidence 0.50) | Rephrase to clarify metric vs. dimension vs. date, or save it and choose a chart yourself |
| Expected a line but got bars | The result had no date column, or the wording didn't signal a trend | Include a date grain and trend wording like "over time" or "last 30 days" |
| Expected a pie but got bars | Pie needs share/distribution wording, one metric, one dimension, and 8 rows or fewer | Add a word like "share" or "breakdown" and narrow the result |
| "Add to mosaic" shows "No mosaics yet" | You have no mosaics in this workspace | Choose + New mosaic / + Create new mosaic to make one as you add the tile |
| Orion declines to run raw SQL | The run_sql path is restricted for your role by the data-security guard | Ask via a governed reveal, or have a Luminary grant the access you need |
| Save fails with a network error | The save-as-reveal or add-to-mosaic request didn't reach the server | Retry; the save bar shows the error inline and lets you try again |
Related pages
- Orion chart copilot — edit an existing chart by describing the change.
- Asking Orion questions — how to phrase questions Orion can answer.
- Chart types — the full set of charts Celiq supports.
- Mosaics — build dashboards from tiles, including ones pinned from Orion.